Analytics & insights

See where your class stands, from first lesson to final grade

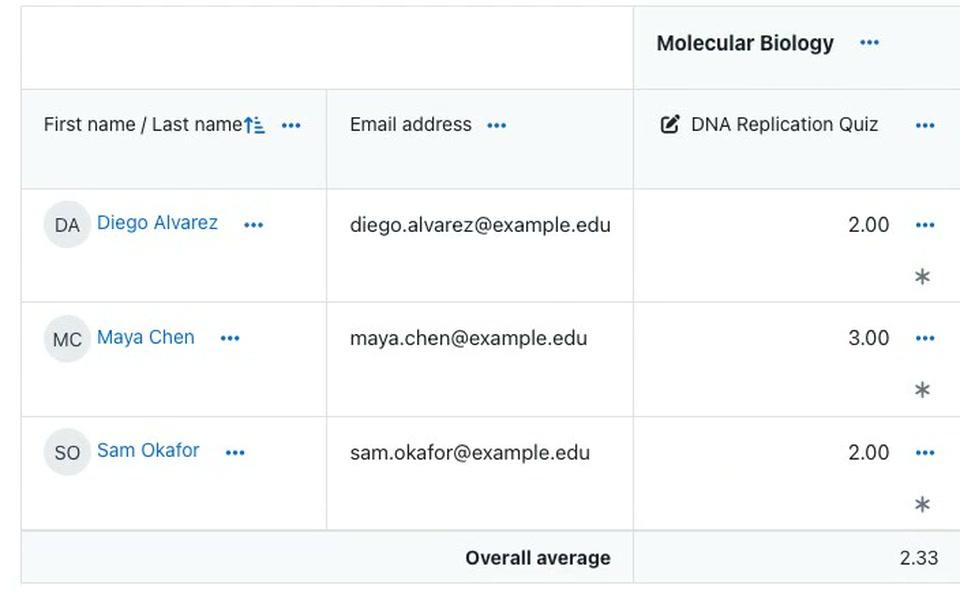
Reports that open inside your LMS course. Follow one term with your class: where students stall, which questions trip them up, who needs a hand, and the evidence for each learning outcome.

Quiz analytics
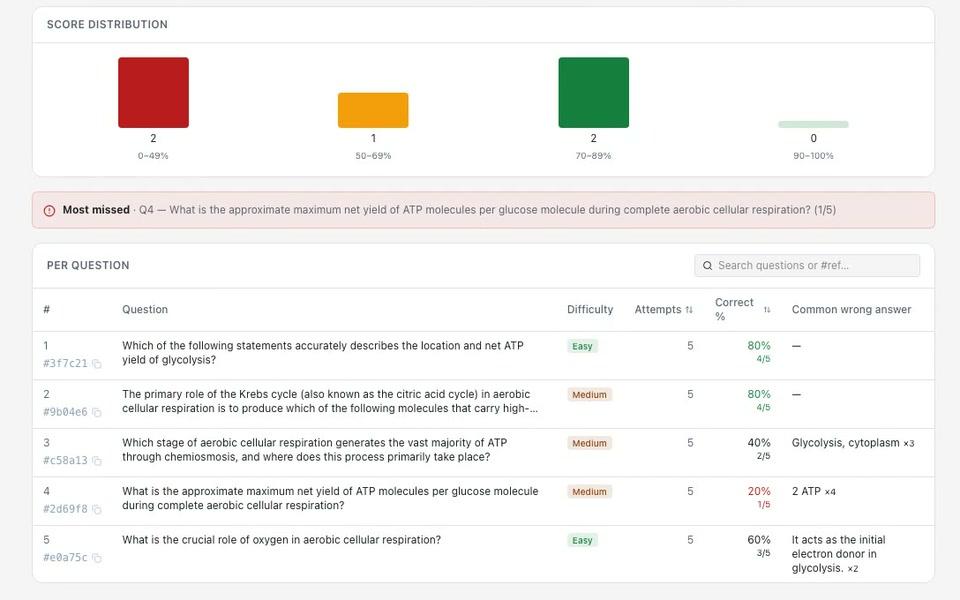
Quiz item analysis: score-distribution bars, a Most missed callout, and each question with its difficulty, attempts, percent correct and the most common wrong answer
1Before the next quiz

Start from questions that already work

Your question bank keeps score while you teach. Each question shows how often students tried it and how often they got it right, so you reuse the strong ones and fix the rest.

  • Question Banks: attempts, percent correct and the number of quizzes that use each question
  • Filter by difficulty, and by used or unused
  • Bank-wide totals: attempts, students and average percent correct
Question Banks
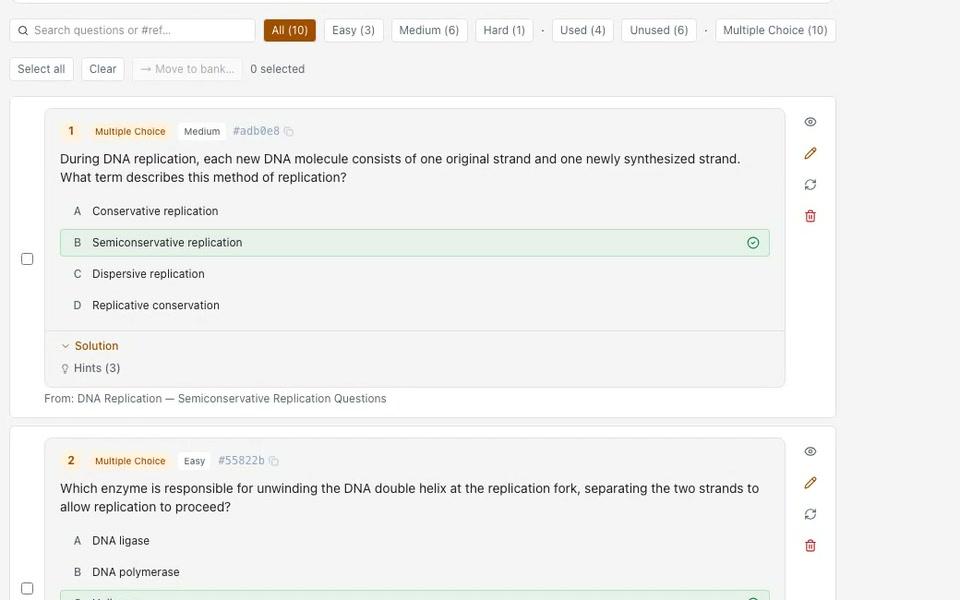
A course question bank: difficulty and used or unused filters above multiple-choice questions with the correct answer marked
2While they learn

Where are students stalling?

As students work through a module, you see who finished which lesson and where they stopped. The AI Tutor's log shows what they asked, and which questions your materials don't cover yet.

  • Module analytics: a lesson-by-lesson funnel of views, completions and drop-off
  • Module Progress: lessons done, progress and last active for each student
  • Unanswered Tutor Questions: the questions the tutor declined as outside your materials, most-asked first
Module Progress
Module Progress report: lessons-done bars per student above a table of student, module, lessons done, progress and last active
3After a quiz

Which questions tripped the class up?

Open the quiz's analytics once the class has taken it. The question most students missed is flagged at the top, next to the wrong answer they kept choosing.

  • Score distribution across the class, and the class average
  • Per question: difficulty, attempts and percent correct
  • The most common wrong answer, so your next lesson can target it
Ask Cog“How did the class do on the Module 2 quiz?”
Quiz analytics
Quiz item analysis: score-distribution bars, a Most missed callout, and each question with its difficulty, attempts, percent correct and the most common wrong answer
4After marking

How did the class do, and are the grades in?

AI grading marks each submission against your rubric. One report shows every score and whether it has reached your LMS gradebook.

  • Assessment Submissions: score, percent and gradebook status for each student
  • Average score and per-criterion averages for each assessment
  • Scores land in your LMS gradebook over LTI 1.3 — posted once, with status tracked so nothing is lost.
Assessment Submissions
Assessment Submissions report: score bars per student, then rows with AI status Graded, score out of 12, percent and gradebook Sent
5Any week of term

Which students need a hand this week?

EduGears AI flags students who have gone quiet, fallen behind or are scoring low, with the reason for each. Or just ask Cog.

  • At-Risk Learners: inactive, behind, low scores or many declined tutor questions, against thresholds you save per course
  • An at-risk card on your Dashboard, with the reason next to each name
  • Daily or weekly email alerts that mark who is new; no one flagged, no email
Ask Cog“Which students need help on the Cellular Respiration Quiz?”
Cog Insights
Cog Insights beside quiz analytics, answering which students need help on a quiz: each student named with their scores, and the reports it read
6Evidence for outcomes

Can you show what students learned?

Map your course's learning outcomes to modules. Outcome Progress then shows, for each outcome, how many students engaged and how far they got.

  • Write the outcomes yourself, or have AI draft them from your course materials for you to edit and approve
  • Per outcome: students engaged, average progress and average quiz score in the mapped modules
  • Evidence from mapped content, not certified mastery
Outcome Progress
Outcome Progress report: average progress per learning outcome, with mapped modules, students engaged, and unmapped outcomes marked Not mapped

What stays true

Inside your LMS

Reports open in the EduGears AI tool in your course. No separate login.

Your course only

Reports show the students in the LMS course you open them from; a section's teacher sees that section.

Every report exports CSV

Take the rows to a spreadsheet or your own systems.

Cog reads, never writes

Cog Insights answers from your reports, read-only, within your permissions.

Frequently asked questions

Where do I see analytics?

Inside your LMS, in the EduGears AI tool — no separate login or export pipeline.

Is student data sent anywhere?

Analytics are scoped to your course context, and grades pass back to your own LMS gradebook via the LTI standard.

Can I export results?

Yes. Every report exports to CSV.

Do at-risk alerts go out automatically?

Only for courses whose teachers switch them on in Course Settings. Choose daily or weekly; each email lists the flagged students with the reason for each and marks who is new. When no one is flagged, no email is sent.

Is Outcome Progress a measure of mastery?

No. It shows how many students engaged with the modules mapped to each outcome, their progress and their quiz scores there. It is evidence from mapped content, not certified mastery.

Ready to Add AI to Your LMS?

Get started in under 3 minutes. No credit card required. No intrusive plugins. Just connect and go.